By John Pickard
We have to take ‘graphic’ representations of political parties with a large pinch of salt for a number of reasons. Firstly, because the myriad of policies and aspirations that go to make up a political movement are far too complex to represent mathematically and the consensus of those academics drawing up a scale is necessarily arbitrary.
It is limited by fact thatpolitical scientists, like all academics, will have their own biases and one might suspect that they lean towards small ‘c’ conservatism, at least on average.
But above all, a mathematical representation is questionable because real politics is a complex, dynamic and ever-changing landscape. It is not a still photograph, but a kaleidoscope of shifting and interconnected images where individuals, pressure groups, political parties and many other elements act upon each other to change day by day and week by week. In short, politics is far too complex to be given a number.
Nevertheless, having made that very large caveat, it was interesting to see an article in the Financial Times today (September 30) which attempted to do precisely that – to show political parties as a number on a scale – in order to illustrate the perceived changes in the Tory Party that have taken place under Liz Truss.
The numbers represent, the article explains, the collective view of hundreds of political scientists. These are part of a regular poll by an organisation called Chapel Hill Expert Survey. “Every few years,” the Financial Times explains, “hundreds of political scientists evaluate political parties on various issues, from the environment to law and order, gender issues to the redistribution of wealth”.
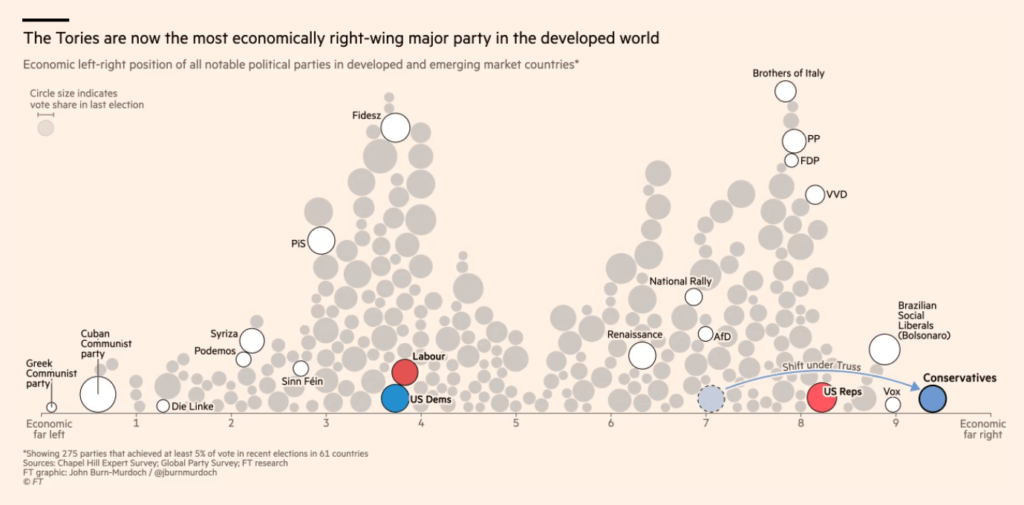
From this survey, political parties around the world are put on an arithmetic scale, from 0 to 10, with zero being the ‘far left’ and 10 being the ‘far right’. The whole point of the article in the Financial Times was to suggest, as the graphic above shows, that under Liz Truss and Kwasi Kwarteng, the Tory Party have moved far to the right and now occupy a position around 9.4 on the scale.
Truss to the right of Brazil’s Bolsonaro
As the article explains, “This [survey] puts them well beyond where the Republicans stood under Donald Trump, and just to the right of the Brazilian Social Liberal party that took Jair Bolsonaro to power in 2018. Out of 275 parties in 61 countries, the Tories under Trussonomics rank as the most right wing of all.”
If we continue to suspend our disbelief for a moment longer, what is also interesting, but not commented on by the Financial Times, is that a second graphic (below) allegedly showing the broad views of voters of different UK political parties, demonstrates how the Labour Party has changed under Keir Starmer.
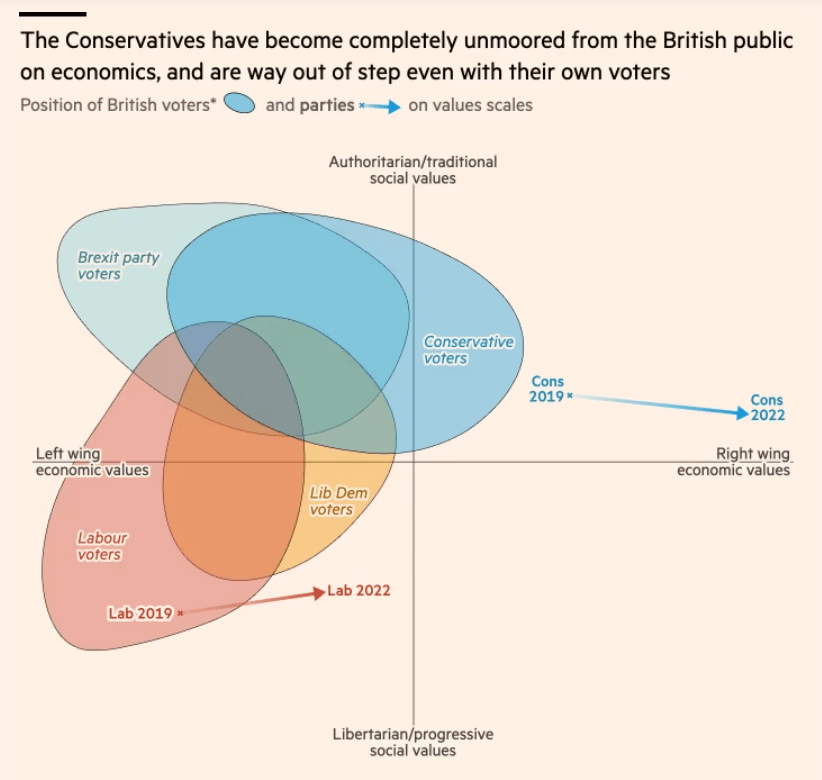
This second graphic shows a number of things. Firstly, that Labour has moved to a position where it is to the right of all Labour voters, most Lib-Dem voters, and about half of Tory voters. The second point is that the article claims the average position UK voters is at 3.1, which puts the Labour Party leadership under Starmer – at 4.2 – to the right of the average voter. All of this might be very tongue in cheek, but in fact it is in accord with what socialists in the Labour Party have argued.
It is well established in opinion polls that most voters, and that would not just include Labour voters, favour the renationalisation of those utilities privatised by Thatcher. but it is a policy ignored by Starmer. The so-called ‘centre’ ground has itself shifted left, just as the Labour leadership have leap-frogged over it to the right.