
By Michael Roberts
I have written before about the fact that, both in advanced and so-called ’emerging economies’, wealth is significantly more unequally distributed than income. Moreover, the pro-capitalist World Economic Forum has reported that: “This problem has improved little in recent years, with wealth inequality rising in 49 economies.”
The usual index used for measuring inequality in an economy is the Gini index which is the Gini coefficient expressed as a percentage. A Gini coefficient of zero expresses perfect equality, where all values are the same (for example, where everyone has the same income). A Gini coefficient of one (or Gini index 100%) expresses maximal inequality among values (e.g., for a large number of people where only one person has all the income or consumption and all others have none, the Gini coefficient will be nearly one).
For the US, the current Gini index for income is 37.8 (pretty high by international levels), but the Gini index for wealth distribution is 85.9! Or take supposedly egalitarian Scandinavia. The Gini index for income in Norway is just 24.9 but the wealth Gini is 80.5! It’s the same story in the other Nordic countries. The Nordic countries may have lower than the global average inequality of income but they have higher than average inequality of wealth.
Wealth share of the richest increasing
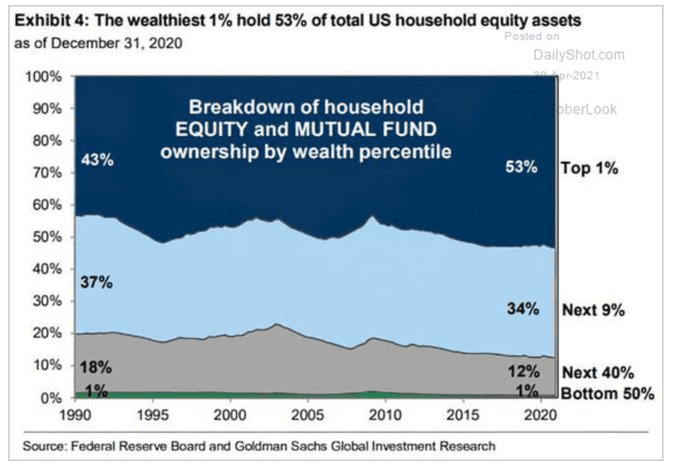
Another way of measuring inequality is to consider the share of wealth or income that the top 10% or top 1% have. And we can break personal wealth down into two main categories: property wealth and financial wealth. A larger section of the population has property wealth, although this is very unequally distributed. But financial wealth (stocks and shares, bonds, pension funds, cash etc) is the province of a tiny number of people and so is even more unequally distributed. The latest figure for the US for financial wealth inequality is truly staggering on this measure. The richest 1% of US households now own 53% of all equities and mutual funds held by American households. The richest 10% own 87%! Half of America’s households have little of no financial assets at all – indeed they are in debt. And that inequality has been rising in the last 30 years.
And as the World Economic Forum (WEF) says, after the huge rise in the prices of property and financial assets over the last 20 years, fuelled by cheap credit and reduced taxation, this concentration of personal wealth has increased sharply – something that Thomas Piketty in his book, Capital in the 21st century, highlighted several years ago.
The latest data for Italy, one of the top G7 economies, confirms this increased inequality of wealth. In a new study of Italian inheritance tax records, researchers found that the wealth share of the top 1% (half a million individuals) increased from 16% in 1995 to 22% in 2016, and the share accruing to the top 0.01% (the richest 5,000 adults) almost tripled from 1.8% to 5%. In contrast, the poorest 50% saw an 80% drop in their average net wealth over the same period. The data also revealed the growing role of inheritance and life-time gifts as a share of national income, as well as their increasing concentration at the top. The huge wealth of a few individuals is getting larger because it can be passed onto relatives with little or no taxation.
Extreme wealth inequality in South Africa
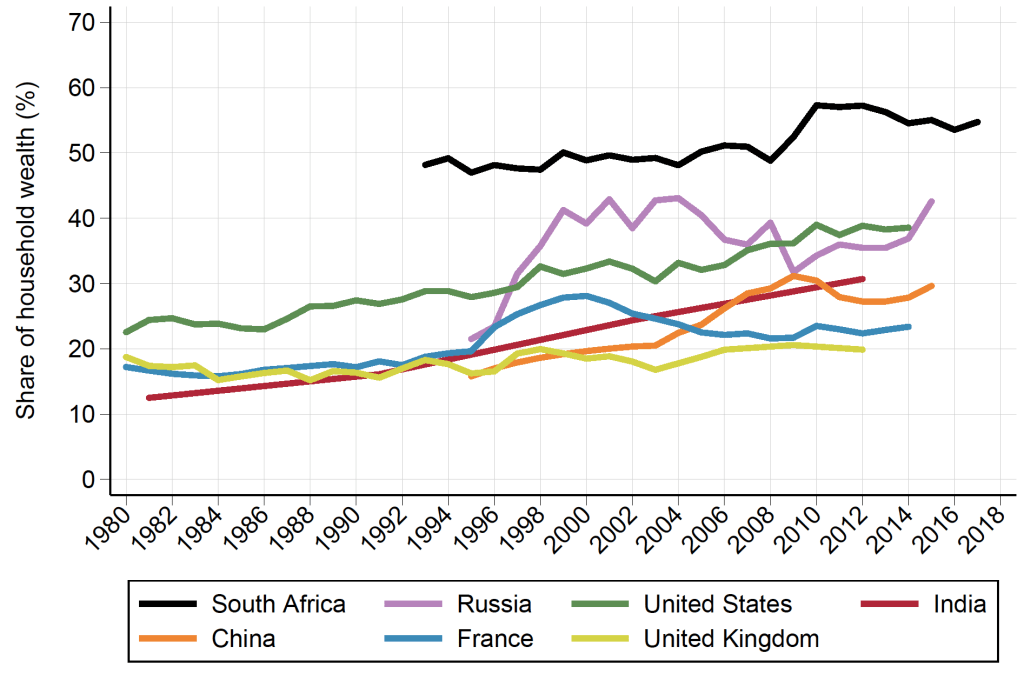
But the concentration of personal wealth in the advanced capitalist economies is nothing compared to what is happening in the poorer nations of the world. A new study compared the inequality of wealth in South Africa against similar ’emerging economies’ and also historically since the end of apartheid. Extreme wealth inequalities in South Africa have got worse, not better, since the end of the apartheid regime. Today, the top 10% own about 85% of total wealth and the top 0.1% own close to one-third. South Africa continues to hold the dubious honour of having the worst wealth inequality among the major economies of the world. The South African top 1% share has fluctuated between 50% and 55% since 1993, while it has remained below 45% in Russia and the US and below 30% in China, France, and the UK.
Ownership of productive capital
But as I have argued before, real wealth concentration is about the ownership of productive capital, the means of production and finance. It’s big capital (finance and business) that controls the investment, employment and financial decisions of the world. A dominant core of 147 firms through interlocking stakes in others together control 40% of the wealth in the global network according to the Swiss Institute of Technology. A total of 737 companies control 80% of it all.
This is the inequality that matters for the functioning of capitalism – the concentrated power of capital. And because inequality of wealth stems from the concentration of the means of production and finance in the hands of a few; and because that ownership structure remains untouched, any increased taxes on wealth will fall short of irreversibly changing the distribution of wealth and income in modern societies.
From the blog of Michael Roberts. The original, with all charts and hyperlinks, can be found here.