

By Michael Roberts
In Q1 2024, global stock markets recorded their best first-quarter performance in five years, buoyed by hopes of a soft economic landing in the US and enthusiasm about artificial intelligence. A MSCI index of worldwide stocks has gained 7.7% this year, the most since 2019, with stocks outperforming bonds by the biggest margin in any quarter since 2020.
This global surge has been helped mainly by the US stock index, the S&P 500, which closed at a record high on 22 separate occasions during the last quarter. The AI hype has fuelled the market’s gains, with the major AI chip designer Nvidia adding more than $1tn in market value, equivalent to about one-fifth of the total gain for global stock markets this year! Nvidia’s market capitalisation rose by about $277bn — roughly equivalent to the market value of every listed company in the Philippines, according to HSBC. And as I reported in my last post, there has been a 60% rally in bitcoin dollar prices.
Euphoria over US stock market highs
Euphoria in the US stock market is continuing as investors are convinced that any US economic recession is off the agenda, and instead US economic growth will accelerate this year and drive up global corporate profits. Are they right?
Finance capitalists usually measure the value of a company by the share price divided by annual profits. If you add up all the shares issued by a company and multiply it by the share price, you get the ‘market capitalisation’ of the company — in other words what the market thinks the company is worth. This ‘market cap’ can be ten, 20, 30 or even more times annual earnings. Another way of looking at it is to say that if a company’s market cap is 20 times earnings and you bought its shares, you would have to wait for 20 years of profits to double your investment. And we can get a sort of average price of all the company shares on a stock market by using a basket of share prices from a range of companies and index it. That gives us a stock market index like the S&P-500 index for the top 500 US companies in market capitalization.
Company stock prices can diverge from actual profits and assets
As company stock prices are based on the subjective judgements of financial investors, they can get way out of line with the actual profits made by companies and relative to the value of the assets (machinery, plant, technology etc) that companies own. That’s the current situation. We can measure that divergence in several ways.
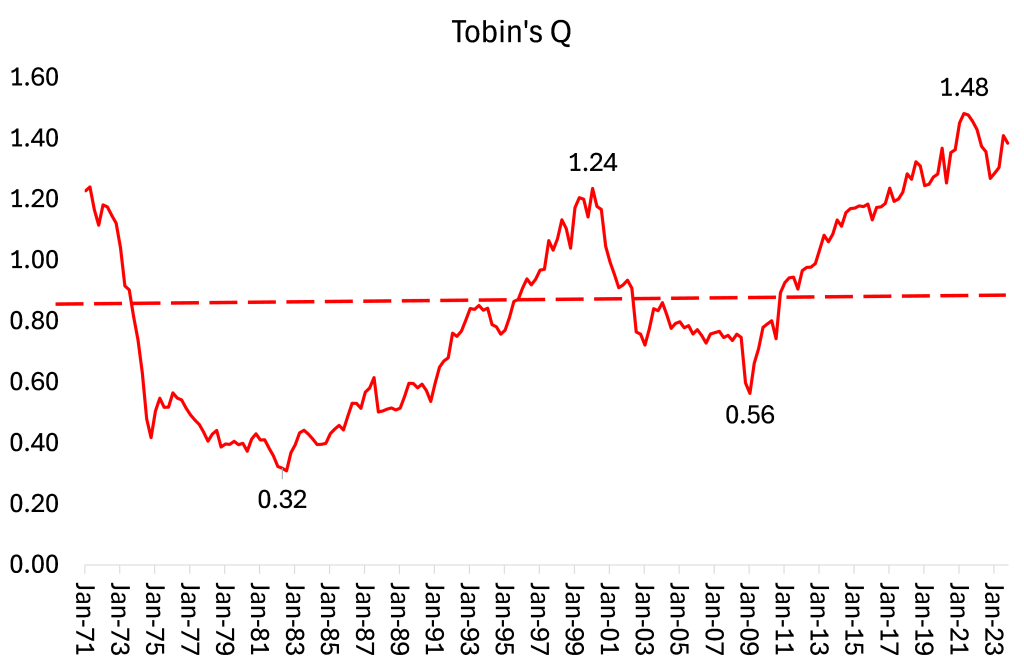
The leftist economist, James Tobin developed a measure of the relation between the market capitalisation’ of the companies in the stock market (in this case the top 500 companies in what is called the S&P-500 index) and divided that by the replacement value of tangible assets accumulated by those companies. The replacement value is the price that companies would have to pay to replace all the physical assets that they own (plant, equipment etc). This is called Tobin’s Q. The current Tobin’s Q reveals that US company shares are valued way above the actual value of the assets that companies own at a ratio of 1.48 compared to the historic average of 0.83.
Another measure of the relation between stock market prices and profits has been developed by the heterodox economist Robert Shiller. He measures the ratio of market capitalization over corporate earnings (after inflation) and averaged over ten years. The Shiller measure tells a similar story to Tobin’s Q.
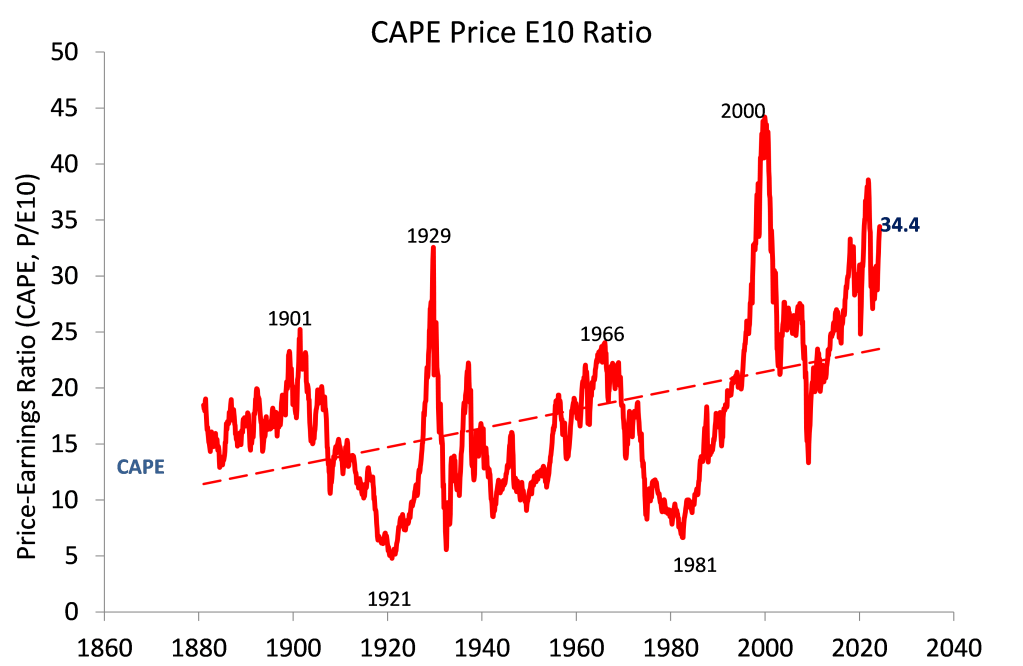
It shows a value well above the trend average measure of stock price to earnings, surpassing the 1929 level with only 2000 being higher, just before the dot.com bust when the great hopes of the internet revolution eventually did not deliver sufficiently higher real earnings and the tech bubble burst.
Warren Buffett measure of the stock market against real GDP
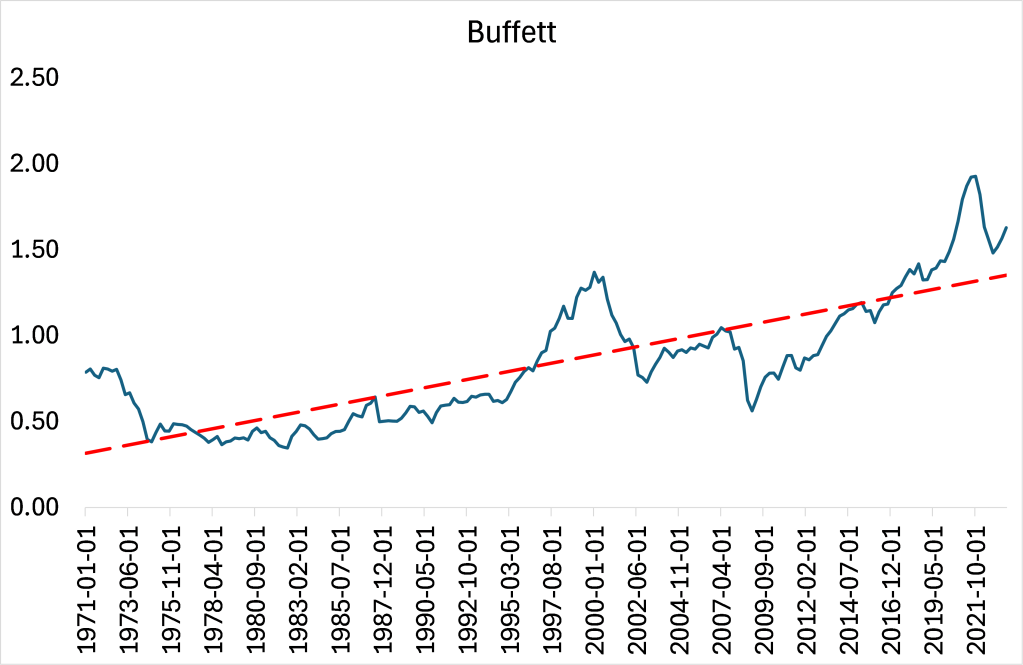
Another measure of the stock market’s relation to reality is favoured by the legendary billionaire investor, Warren Buffett. Buffett monitors the market cap of the US stock market against real GDP, in other words, stock prices versus the real economy. Here is the Buffett measure. Again, it is well above the historic trend growth rate.
So currently, the US and other stock markets are suspended in mid-air, well above real value, because investors hope and expect more real value to materialise. But as I have argued before: “Whatever the fluctuation in stock prices, eventually the value of a company must be judged by investors for its ability to make profits. A company’s stock price can get way out of line with the accumulated value of its stock of real assets or its earnings, but eventually the price will be dragged back into line.”
Limited growth relative to earnings outside of the ‘Magnificent Seven’
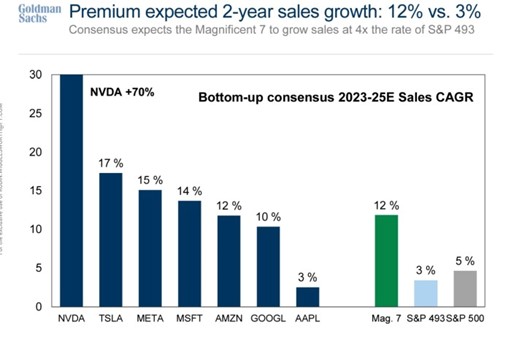
And there are already faultlines in this current market boom. In the US, the S&P 500 stock index (for the top 500 US companies) has been almost totally driven by the seven large social media, tech and chip companies – the so-called Magnificent Seven (Alphabet, Amazon, Apple, Meta, Microsoft, Nvidia and Tesla). They now sport a market cap of around $12 trillion. The market prices of the other 493 companies in the S&P index have hardly moved relative to earnings.
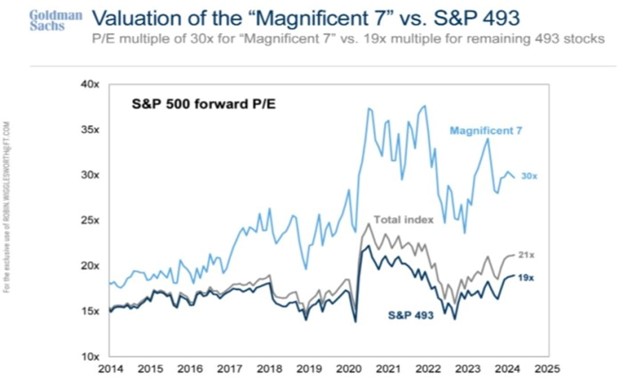
While analysts still make huge optimistic forecasts in 2024 for the Magnificent Seven, earnings forecasts for the rest are dismal. In 2023, the Magnificent 7 grew sales by 15% year on year (yoy) leading to earnings growth of 58%. In contrast, the remaining 493 stocks in the S&P 500 grew sales by only 3%, while earnings fell by 2%. So the market index depends on the Magnificent Seven sustaining these profit gains. Earnings growth estimates in 2024 for the Magnificent Seven are 20.8%, and S&P 500 sans-Magnificent Seven at only 6.7% respectively.
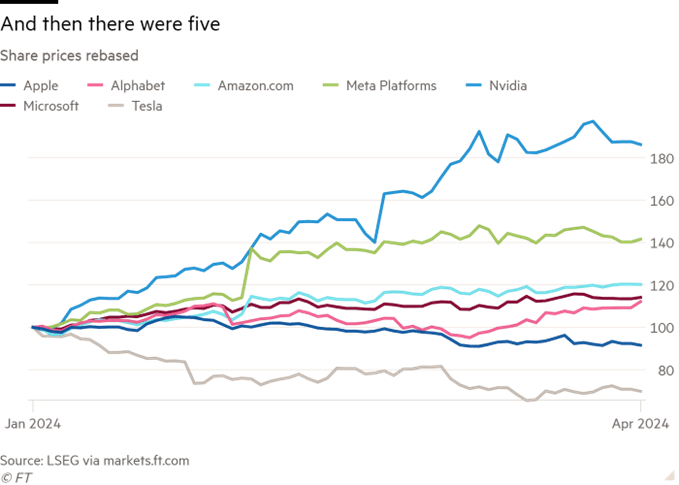
And the Magnificent Seven is losing members: Apple (falling I-phone sales especially in China) and Tesla (falling Electric Vehicle sales as Chinese EVs take over).
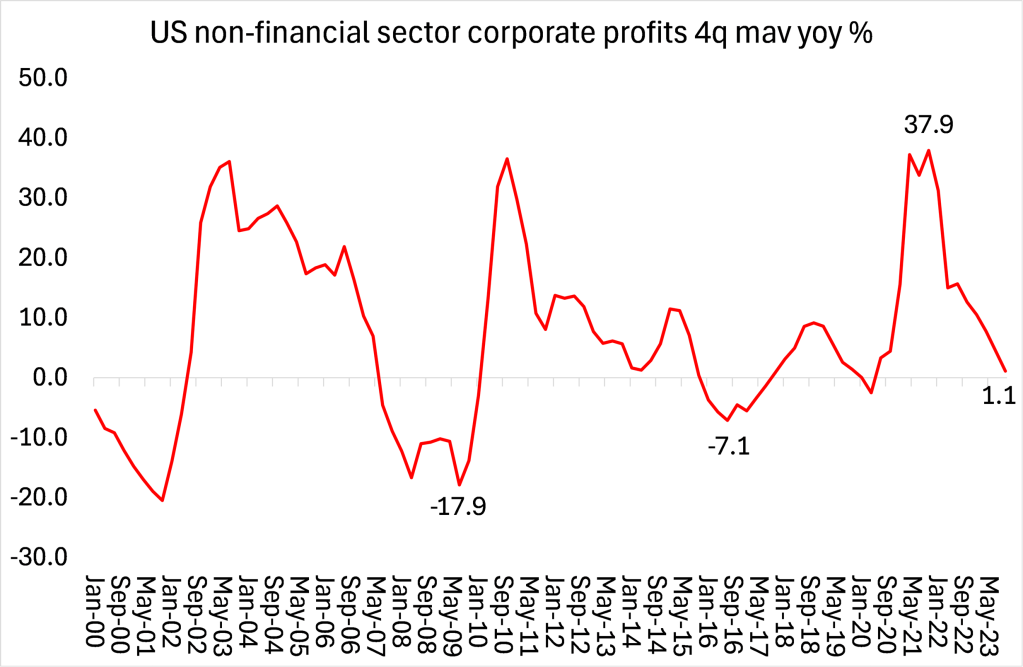
Falling profits will lead to reversal of stock market boom
Fundamentally, if US corporate profit growth slows (and it is) and interest rates on borrowing stay high, then the squeeze on stock prices will eventually lead to a reversal of the current market boom.
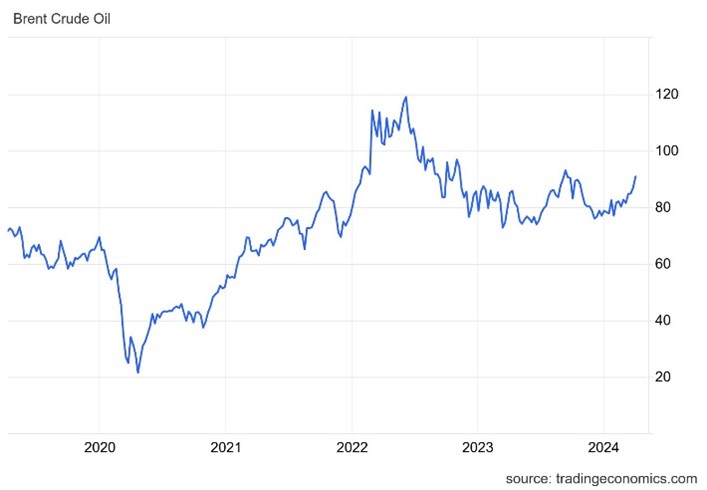
Investors have been expecting three cuts in the policy rate of the Federal Reserve this year as inflation rates fall. But it seems that the ‘last mile’ in achieving ‘normal’ inflation is now in jeopardy. What caused the inflationary spike back in 2021-23 was mainly due to energy and food prices. And both these are now turning back up again.
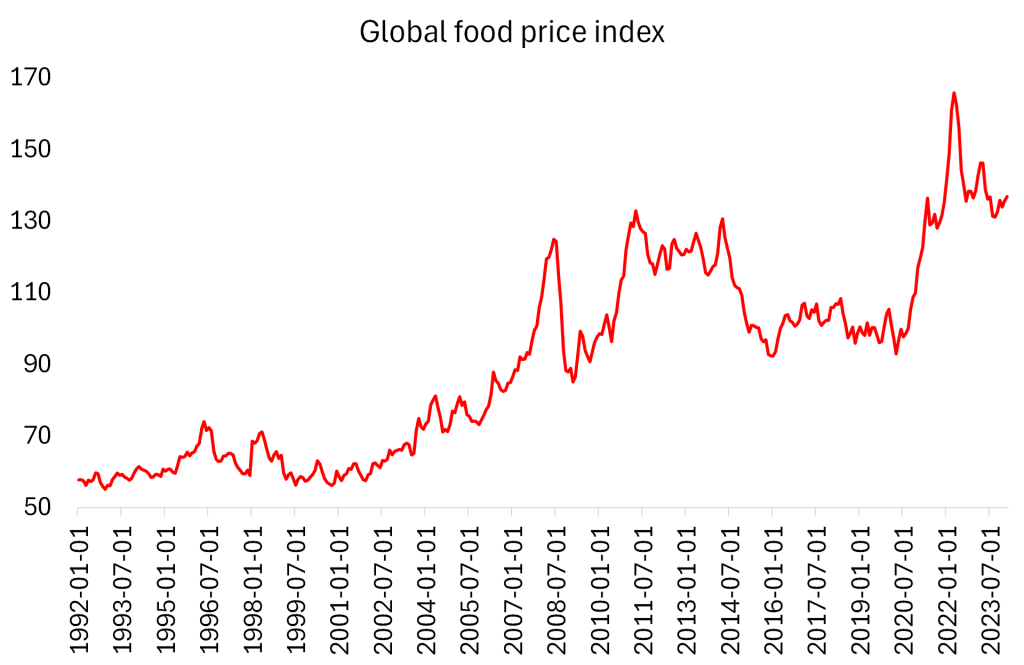
If inflation stays ‘sticky’ or even rises, then the Fed will hold off cutting its policy rate and borrowing costs will stay high. That will eat into net profits of most companies that are already struggling. The risk of bankruptcies among so-called ‘zombie’ companies will increase.
Massive debt servicing costs
Up to now, debt servicing costs have stayed relatively low because companies had loans or bonds issued with terms of several years when interest rates were very low. But as more companies have to refinance, interest costs on their debt will rise.
Mainstream economists and media make much of rising public sector debt and the costs of servicing that debt. In the US, the cost to the budget will reach $1trn and exceed spending on public services outside of social security and Medicare. The demand is that public sector must reduce its debt through higher taxes and more public spending cuts. That’s a bleak prospect for American households.
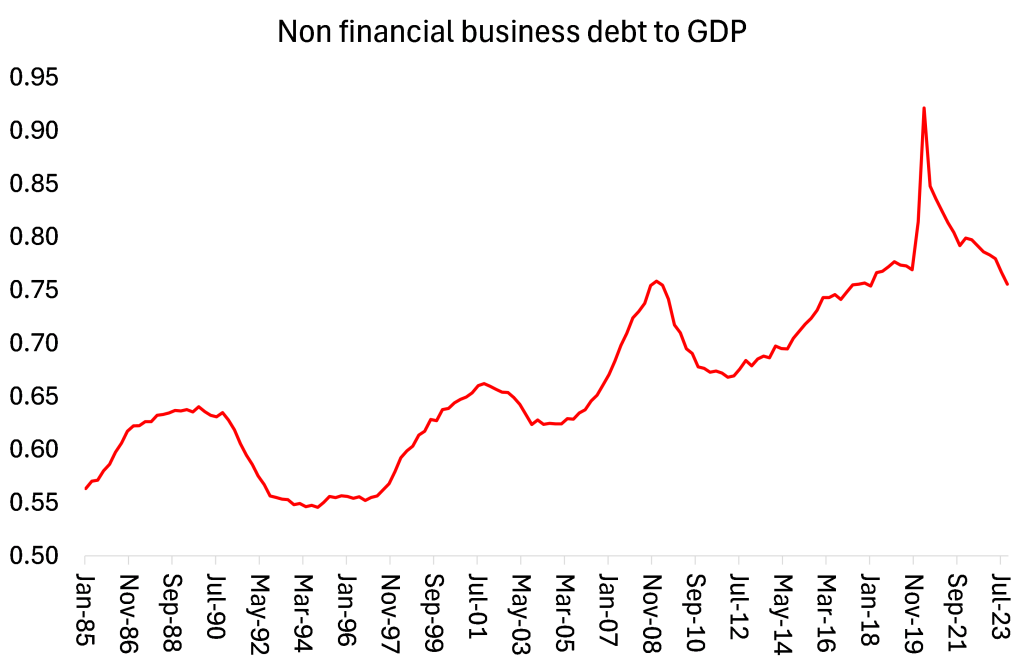
But for the health of capitalist investment and production, it is the level of non-financial business debt that matters, not the public debt. US non-financial business debt is near all-time highs.
Goldman Sachs economists estimate that $790 billion of US corporate debt is set to mature in 2024, followed by $1.07 trillion of debt maturing in 2025. That amounts to $1.8 trillion of debt reaching maturity within the next two years. The average interest rate on corporate debt will likely rise to 4.3% in 2024 and 4.5% in 2025.
Debt crisis in the Global South
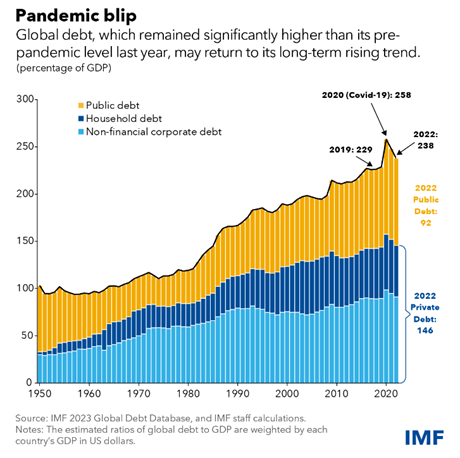
And talking of rising debt, the real crisis right now is among the countries of the Global South. Over $15 trillion was added to the global debt mountain last year, bringing the total to a new record high of $313 trillion, up from $210trn just a decade ago. Emerging and developing economies have been the worst hit by previous debt crises, World Bank research shows. To meet debt payments, at least 100 countries will have to reduce spending on health, education and social protection, the IMF estimates. Debt distress is when a country is unable to fulfil its financial obligations, such as repayments due on its debt. The IMF and World Bank reckon 60% of low-income countries are at or near this point.
What is to be done to end the debt distress for these countries? The existing international agencies and mainstream economists offer two alternative strategies. The first is to ‘restructure’ the debt. That means poor governments unable to meet their debt obligations must negotiate with a host of creditors like the IMF, the World Bank, other governments, banks and hedge fund bond holders to get them to agree to a ‘haircut’ on what they are owed and/or agree to push out the times for repayments and reduce the interest on loans. But there is no cancellation of the debt (often crippling and odious), just renegotiation. And renegotiation is often blocked by private lenders which demand their pound of flesh on time.
Take Zambia. The Zambian government has finally reached an agreement with a steering committee of investors to restructure its three outstanding eurobonds, more than three years after defaulting. Two initial agreements were rejected in November, once by the IMF and twice by the Official Creditor Committee (OCC). There is no cancellation of the debt. Zambia still owes $1.35bn on one bond and will get a small reduction in the value of another. But this haircut is balanced by a steeper repayment schedule: $498m to be paid next year to the IMF; and $578m each year from 2026 to 2028.
How Jamaica has responded to this debt crisis
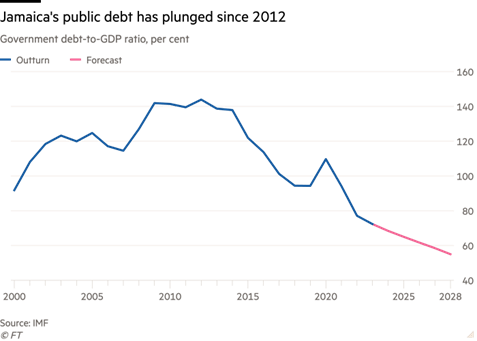
The alternative solution offered to countries in serious debt to foreigners is to cut public spending and raise taxes to obtain sufficient budget surpluses to repay the debt – in other words, fiscal austerity. Take Jamaica, a tiny island state. Recently, Jamaica has been heralded by mainstream economists as a great success story in paying down its debt, halving its government debt to GDP ratio from 144% in 2012 to 2023.
We are told that this great achievement should be a guide to other poor countries on getting their house in order by running ‘austere’ budgets – with surpluses much higher than even Greece was forced to run after the Troika crisis of 2015.
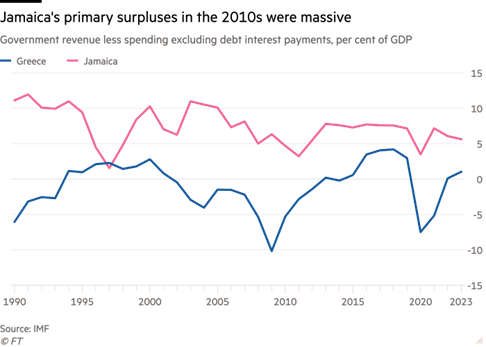
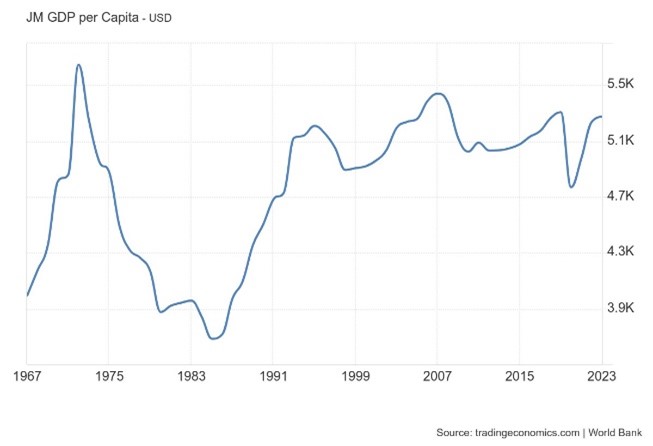
It is claimed that tiny Jamaica (hardly a model for others, I think) achieved this fiscal improvement without any rise in unemployment. But even those presenting their glowing report on Jamaica’s fiscal prudence had to admit that infrastructure spending was suppressed ie government investment forced down and “we don’t have a clear sense of whether a little less fiscal consolidation— if the additional funds had gone into things like education spending or health spending — might have been equally good or better.” Indeed. Actually, during the last ten years, Jamaica’s economy and living standards have stood still -as measured by per capita income. Hardly a poster for the austerity alternative.
For Global South economies deep in unrepayable debt, the current choice is: rescheduling often on even harsher terms; or forced stagnation of the economy to pay back foreign creditors. From the Magnificent Seven to the Desperate Hundred.
From the blog of Michael Roberts. The original, with all charts and hyperlinks, can be found here.