
By Michael Roberts
Once again, it is time to look at what is happening to the rate of profit on capital in the US. I do this every year and the official US data are now available to measure the rate of profit up to and including 2020 – the year of the COVID.
How to measure the rate of profit
As I have said before, there are many ways to measure the rate of profit (for the various ways, see http://pinguet.free.fr/basu2012.pdf) a la Marx. I prefer to measure the rate of profit by looking at total surplus value in an economy against total private capital employed in production; to be as close as possible to Marx’s original formula of s/C+v, where s = surplus value; C = constant capital – which should include both fixed assets (machinery etc) and circulating capital (raw materials and intermediate components); and v = wages or employee costs. My calculations can be replicated and checked by referring to the excellent manual explaining my method, kindly compiled by Anders Axelsson from Sweden.
I call my calculation a ‘whole economy’ measure, as it is based on total national income after depreciation and after employee compensation to calculate surplus value; net non-residential private fixed assets for constant capital (this excludes housing and real estate); and employee compensation for variable capital. But as said above, the rate of profit can be measured just on corporate capital or just on the non-financial sector of corporate capital. Profits can be measured before or after tax and the fixed part of constant capital can be measured based on ‘historic cost’ (the original cost of purchase) or ‘current cost’ (what it is worth now or what it would cost to replace the asset now).
Measuring circulating capital
Most Marxist measures actually exclude any measure of variable capital on the grounds that ‘employee compensation’ (wages plus benefits) is not a stock of invested capital but a flow of circulating capital turning over more than once in a year – and this rate of turnover cannot be measured easily from available data. So most Marxist measures of the rate of profit are just s/C. But some Marxists have made attempts to measure the turnover of circulating capital and variable capital (wages) so that these can be added to the denominator, thus restoring Marx’s original formula s/C+v.
Brian Green has done some important work in measuring circulating capital and its rate of turnover for the US economy, in order to incorporate it into the measure of the rate of profit. He considers this vital to establishing the proper rate of profit and as an indicator of likely recessions. Here is Green’s recent post on this: https://theplanningmotivedotcom.files.wordpress.com/2021/11/1997-2020-various-rates.pdf.
On his formula, Green finds there is an average turnover of circulating capital of around 4 (Graph 2) and he shows in Graph 10 that circulating capital averages (over nearly 25 years) about 22% compared to fixed assets with little variation. Green’s work is valuable in showing the short-term variations in rates of surplus value and profit caused by changes in circulating capital, but it does not alter significantly the longer-term trends in the rate of profit. Moreover, if you include circulating capital and variable capital in the measurement of the rate of profit, this will make a difference to the level of the rate of profit, but not much difference to the trend and turns in the rate of profit.
A ‘whole economy’ measure of the US rate of profit
Anyway, here is my ‘whole economy’ measure of the US rate of profit on the stock of capital from 1945-2020.
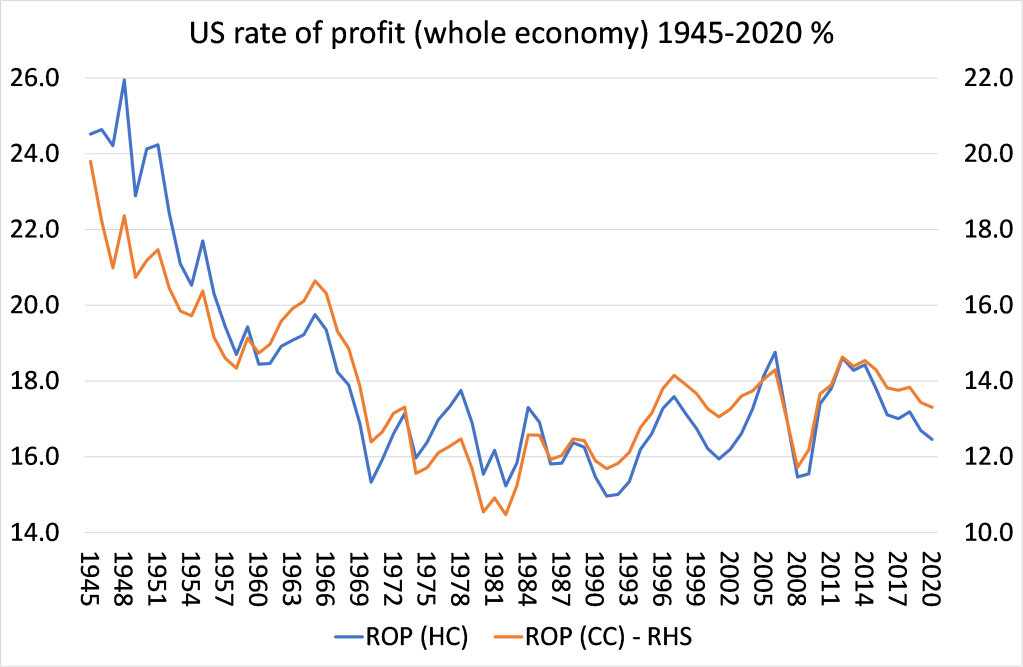
HC means the historic cost measure and CC means the current cost measure of fixed assets in C. It used to be a big discussion over which measure of fixed assets to use to get closer to the Marxian view. For an explanation of this debate, see my previous posts and my book, The Long Depression (appendix). The two measures differed in the 1960s particularly and from the 1990s. The difference is caused by inflation. If inflation is high, as it was between the 1960s and late 1980s, then the divergence between the changes in the HC measure and the CC measure will be greater – see http://pinguet.free.fr/basu2012.pdf. When inflation drops off, the difference in the changes between the two HC and CC measures will narrow. From 1965 to 1982, the US rate of profit fell 23% on the HC measure, but 37% on the CC measure. From 1982 to 1997, the US rate of profit rose just 15% on the HC measure, but rose 35% on the CC measure. But over the whole post-war period up to 2019, there was a secular fall in the US rate of profit on the HC measure of 33% and on the CC measure 33%!
Increased proportion of profits from the financial sector
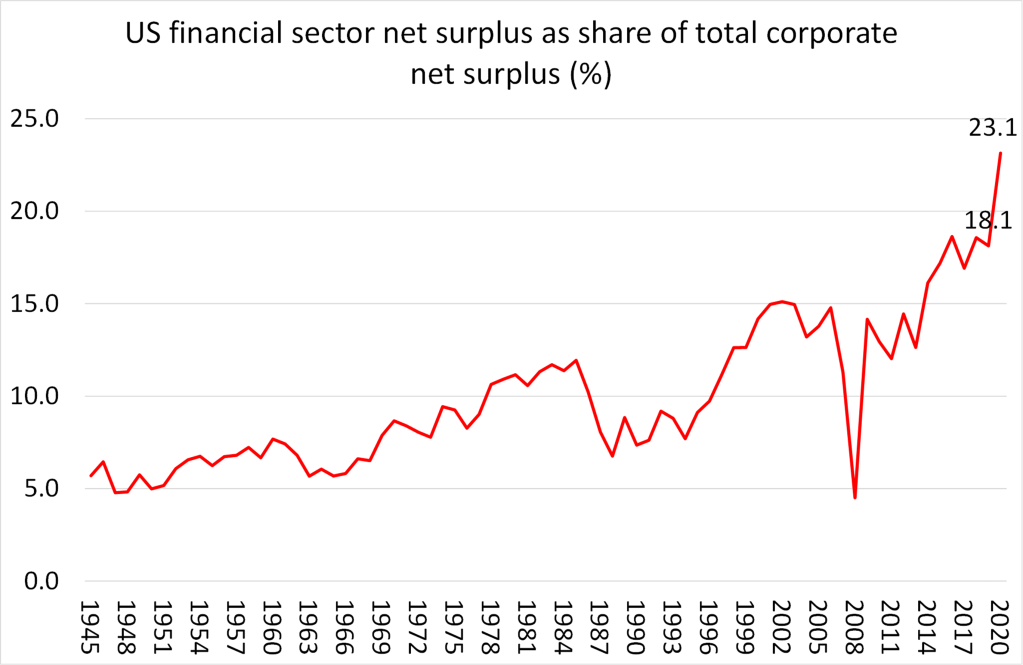
What you do notice from my ‘whole economy’ measure is that the US rate of profit appears to have risen from 1982 up to a peak in 2006 to reach a level not seen since the ‘golden age’ of the 1960s. Does this mean that the US capitalist economy was doing okay after all? I think not, because the ‘whole economy’ measure includes profits from the financial sector which have rocketed as a share of total profits in the US since the 1990s, in particular. Indeed, the rise in the share of financial sector profits since 2014 and particularly in the year of the COVID 2020, has been staggering. This has been driven by Federal Reserve injections of near zero-cost credit to the banks and financial institutions, enabling them to speculate in financial markets and reap net interest income and huge commissions.
The financial sector does not create new value; it takes a cut from the profit extracted from labour in the non-financial sector. And if we look just at the non-financial corporate sector (NFC), a proxy for what we might call the ‘productive’ part of the capitalist economy (where workers create new value for capitalists), then it is a different story. Here I use the measure of the rate of profit for the US non-financial sector that has been carefully calculated by Deepankur Basu and Evan Wasnur. I have replicated their results and highlighted where the rate of profit fell and rose. https://dbasu.shinyapps.io/Profitability/
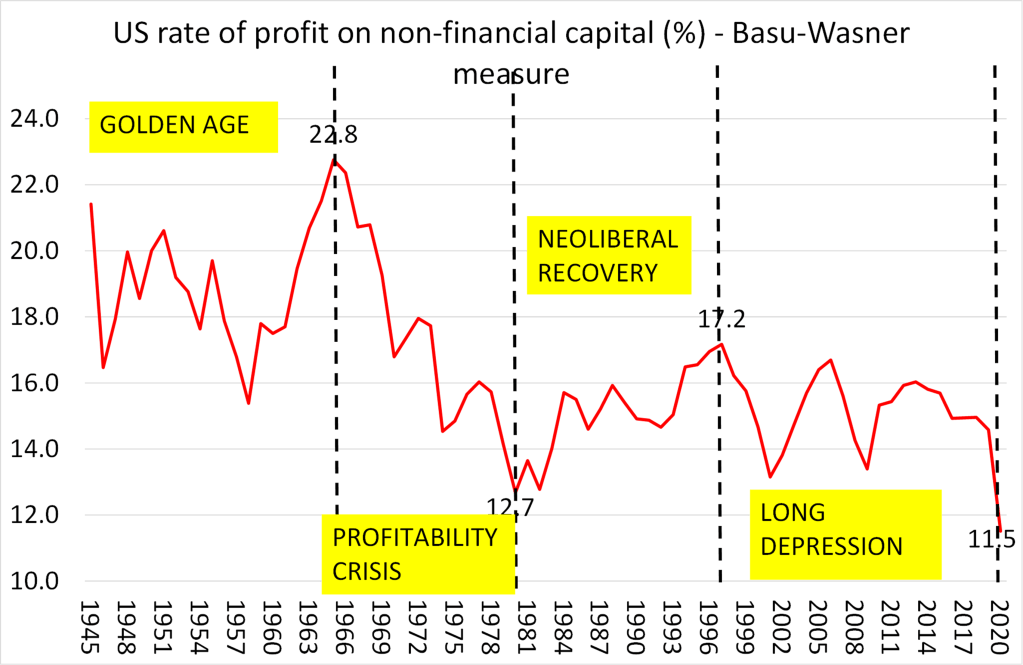
The profitability (P1) measure from Basu-Wasner above is based on the current cost of fixed non-residential assets. And it does not deduct taxes, interest and dividend payments. I have replicated this version because it shows the overall ‘health’ of the US productive sector, before government subsidies or monetary support. What P1 shows is that there has been a secular fall in the US rate of profit on non-financial capital over the last 75 years. Basu-Wasner calculate the average annual fall in the rate of profit at -0.43%. Between 1945 and 2020, the rate of profit fell 46%.
The ups and downs of the rate of profit
But this was not in a straight line. In the so-called ‘golden age’ of post-war US capitalism, the rate of profit was very high, averaging around 20% on this measure and the level rose 6% from 1945-1965. But then came the profitability crisis period between 1965 and 1982, when the rate of profit fell 44%. This provoked two major slumps in 1974-5 and 1980-2, and led to capitalism trying to restore the rate of profit with the neo-liberal policies of privatisation, the crushing of unions, the deregulation of finance and globalisation from the early 1980s. The neoliberal period 1982-97 saw the rate of profit in the non-financial sector rise by 34%, although at the 1997 peak, the rate was still below the average in the golden age. Then came a new period of profitability crisis, which I have dubbed the Long Depression. In this period, which includes the Great Recession of 2008-9 and, of course, the COVID slump of 2020, the rate of profit fell 33%, with a 21% fall in 2020 alone! In 2020, the US rate of profit in its non-financial sector reached a 75-year low.
Causes of the change in rate of profit
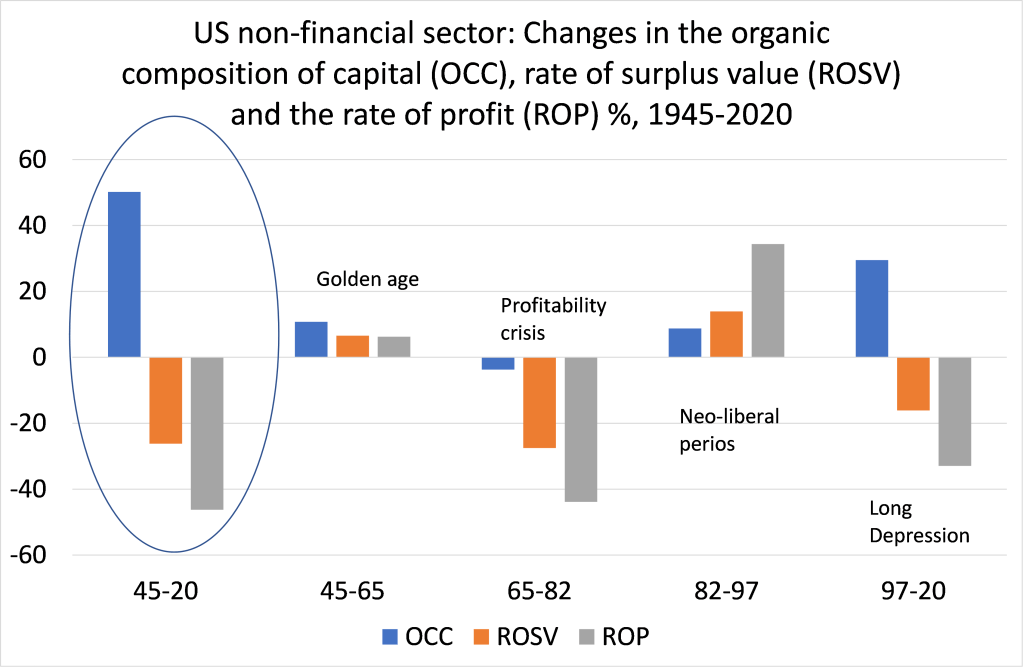
This brings us to the causes of the changes in the rate of profit. According to Marx, changes in profitability depend primarily on the relative movement of two Marxian categories in the accumulation process: the organic composition of capital (C/v) and the rate of surplus value (exploitation) (s/v). On the Basu-Wesnan current cost measure, since 1945, there has been the secular rise in the organic composition of capital of 50%, while the main ‘counteracting factor’ in Marx’s law of the tendency of the rate of profit to fall, the rate of surplus value, has actually fallen over 25%. So the rate of profit fell 32% from 1945.
Conversely, in the so-called ‘neo-liberal’ period from 1982 to 1997, the rate of surplus value rose 14%, more than the organic composition of capital (9%), so the rate of profit rose 34%. Since 1997, the US rate of profit has fallen around 33%, because the organic composition of capital has risen nearly 30%, outstripping the rise in the rate of surplus value (3%). The results for the latter dates are slightly misleading because in the first 14 years of the 21st century, the US rate of surplus value rose nearly 60%, easily outstripping a 23% rise in the organic composition of capital, and so leading to a sharp rise in profitability of 22%. Most of this rise in the rate of exploitation took place in the credit-fuelled boom of 2002-7. But since 2014, there has been a significant fall in profitability leading up to the COVID slump of 2020.
One of the compelling results of the data is that each post-war economic recession in the US has been preceded by (or coincided with) a fall in the rate of profit and then by a fall in the mass of profits. This is what you would expect cyclically from Marx’s law of profitability.
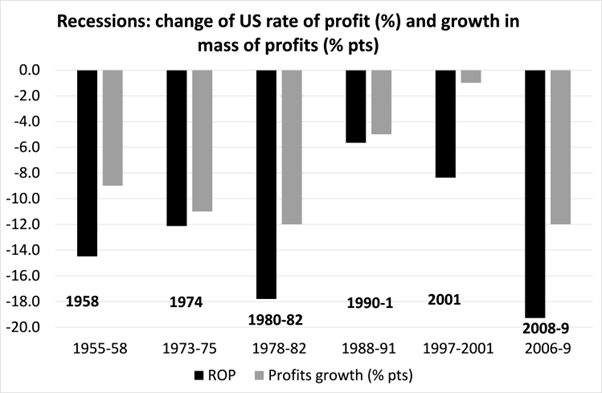
I have argued in many places that the profitability of capital is key to gauging whether the capitalist economy is in a healthy state or not. If profitability persistently falls, then eventually the mass of profits will start to fall and that is the trigger for a collapse in investment and a slump.
The COVID slump took non-financial corporate profits down 20% in 2020. In percentage terms, according to the latest official quarterly figures, profits could have bounced back 25% in 2021. If that is right then, the NFC rate of profit in 2021 will be about 14%, or about a 20% recovery. But that would mean a profit rate still near historic lows and still lower than pre-pandemic in 2019.
From the blog of Michael Roberts. The original, with all charts and hyperlinks, can be found here.